People
The People section is where you manage everyone involved in your research — from real human participants to AI-generated consumer profiles. Build targeted audiences, organize contacts into segments, and track custom attributes to power smarter campaign targeting.
Overview
The People section gives you a complete view of your research audiences. Whether you're building a panel of loyal beauty enthusiasts, creating AI representations of Gen Z consumers, or segmenting your audience by purchase behavior, everything starts here.
What You Can Do in People
- Build AI populations that simulate your target consumers for quick concept testing
- Manage real participants who respond to your video campaigns
- Create segments based on demographics, behavior, or custom criteria
- Track custom attributes like purchase history, preferences, or loyalty tier
- Target the right audience when launching campaigns
Navigation
The People section has five tabs across the top of the page:
| Tab | Description |
|---|---|
| Populations | AI-generated audience profiles representing consumer segments |
| Humans | Real people who participate in your research campaigns |
| Molds | Templates for creating consistent persona profiles when mold access is enabled |
| Lists & Segments | Ways to organize your audiences into reusable groups |
| Properties | Custom attributes you track about your audience |
Access Note
The Molds tab is access-controlled. In current master it is tied to enterprise-manager/support-style access, and related feature flags can also affect availability.
Populations
Empty State Still Exists
The legacy /audience/* route now redirects into /people/*.
Populations is a real page in current master, but you may still see an empty state with the message:
"Stay tuned! We're working on unveiling the new populations feature in your workspace."
This is expected when your workspace has no population data yet. It does not mean the entire Populations feature is missing from the product.

When population data exists, the page supports the normal population management flow: list/grid browsing, search and sorting, detail pages, persona views, and analytics.
Current Product State
- Populations has a real route and detail experience in current master
- the empty state can still appear when there are no populations to show
- older docs that describe Populations as broadly unavailable or hidden behind
/audienceare outdated
Why Use Populations?
Imagine you're launching a new skincare line and want to hear from 200 premium beauty consumers — but your panel only has 50. Populations let you create AI representations of your target audience so you can:
- Test campaign questions before sending them to real participants
- Get diverse perspectives across age, location, and lifestyle
- Validate concepts quickly without waiting for recruitment
- Reduce costs by using AI for initial rounds of feedback
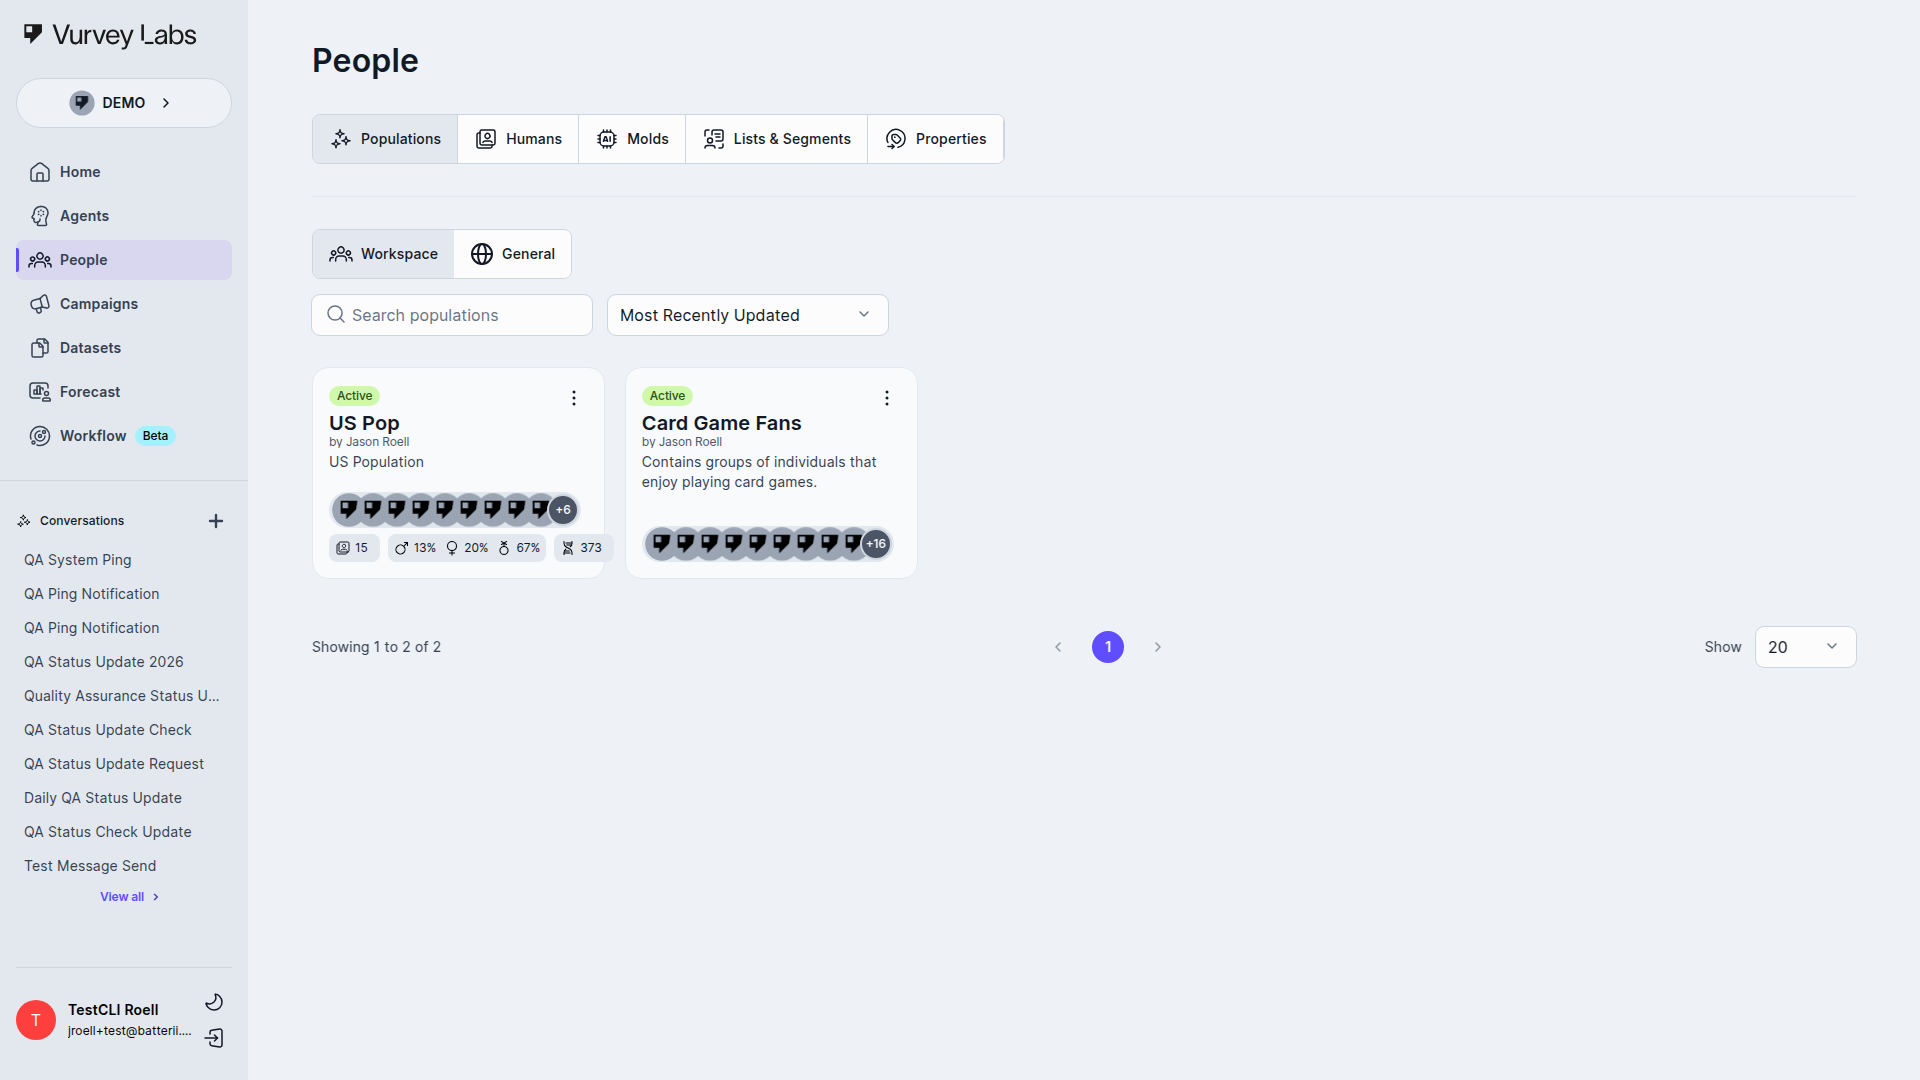
Browsing Your Populations
Populations appear in a card grid. Each card shows the population name, member count, and when it was last updated. Use the search bar to filter by name, or sort by most recently updated.
Click the three-dot menu on any card for the current population actions:
- Show Details
- Take Campaign (requires
aiSimulationEnabledfeature flag) - Change visibility (available for enterprise managers)
- Delete (requires admin role)
Population Details
Click any population card to see detailed analytics about that audience group.
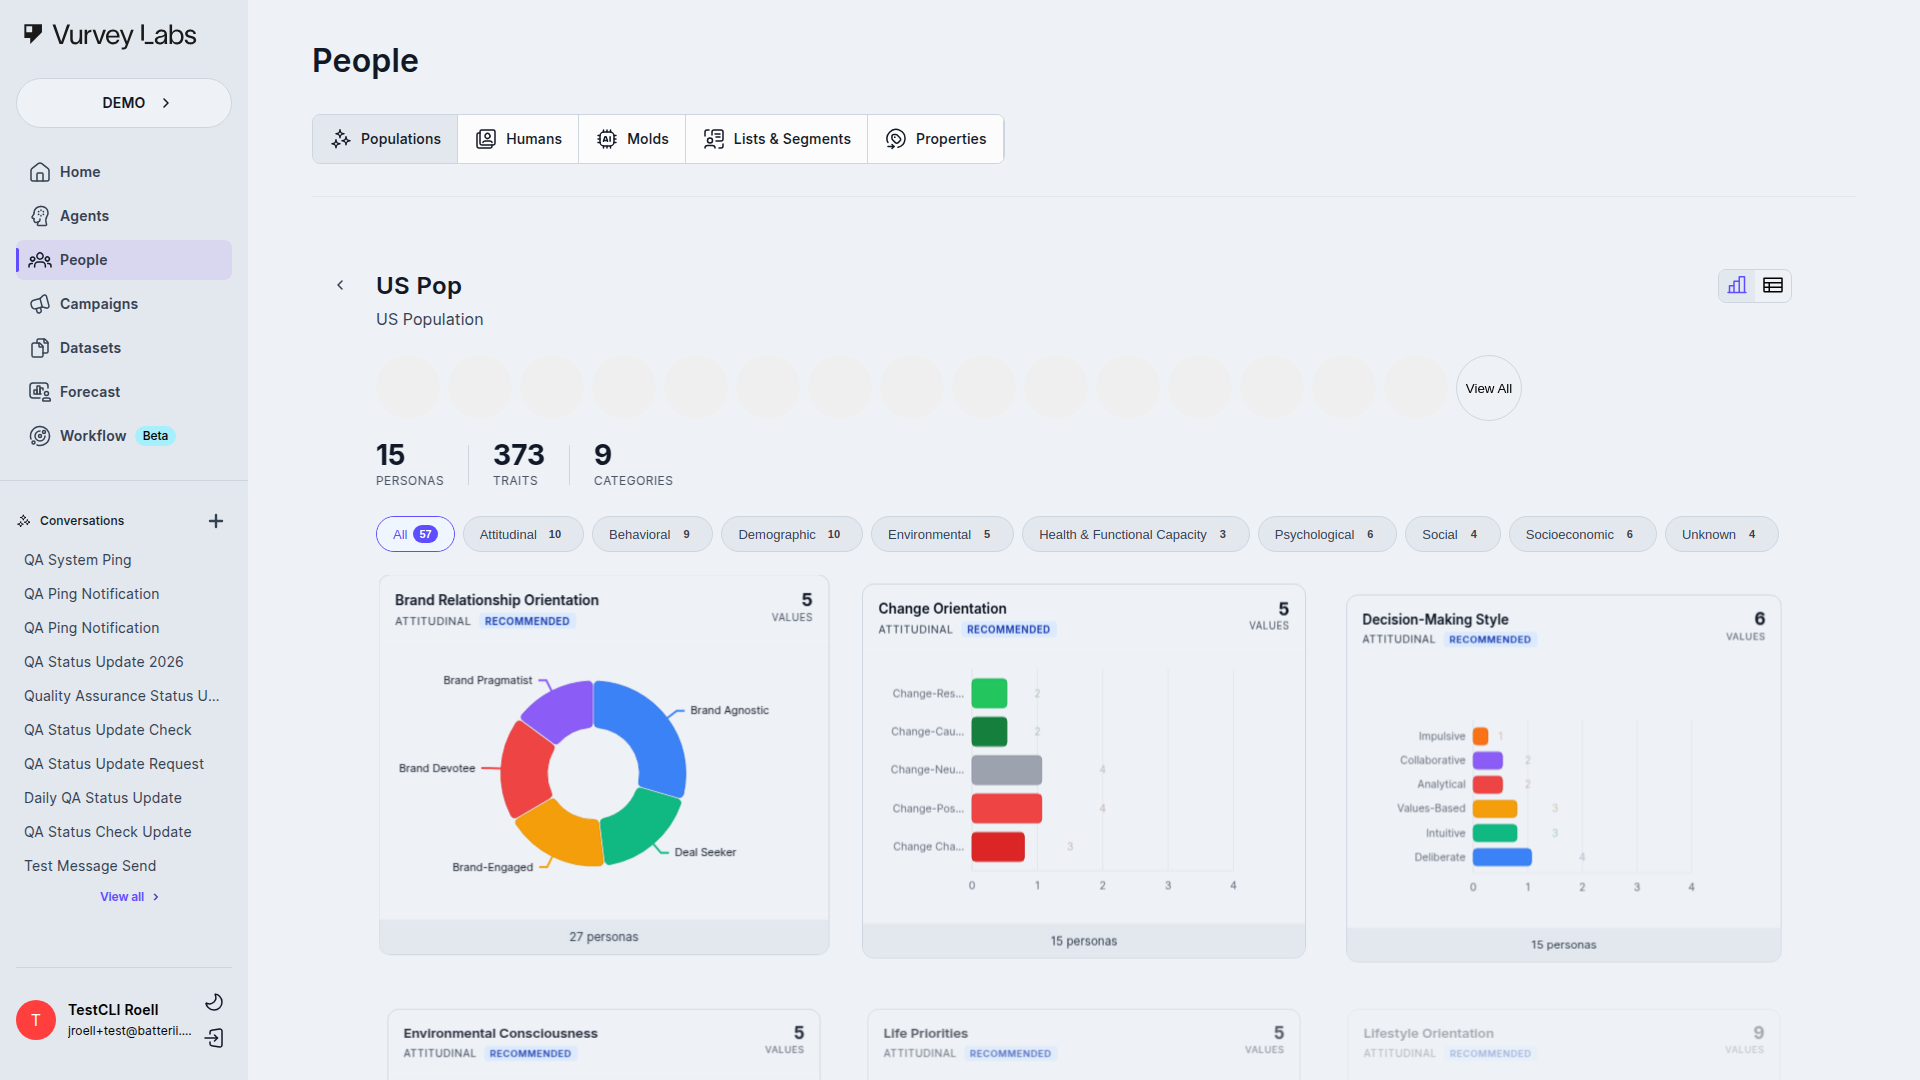
The details page includes:
- Persona Carousel — Browse representative personas with their avatar, name, and key demographics
- Charts View — Visual breakdowns of your population by demographics, preferences, and behaviors (donut charts, bar charts, treemaps, and more)
- Table View — A detailed list of all personas with sortable columns
In the attached-persona table, each row also has a contextual menu with:
- Conversation
- View Details
- Remove from Population (where that action is available)
Use the category pills to filter which demographic facets are displayed. Hover over any chart element for exact counts and percentages.
Understanding Population Analytics
The charts view provides rich visual data about your population. Here's how to read each chart type:
Donut Charts
Donut charts show the proportional breakdown of a single attribute (e.g., age range, gender, location). Each colored segment represents one value. Hover over any segment to see the exact count and percentage.
What to look for:
- Dominant segments — large segments may indicate your population skews toward certain demographics
- Balance — for representative research, check that no single segment overwhelms the rest
- Missing segments — small or absent segments may mean your population doesn't cover certain demographics
Bar Charts
Bar charts compare values across categories (e.g., product preferences, interest areas). Bars are typically sorted from highest to lowest.
What to look for:
- Relative sizes — quickly see which attributes are most common in your population
- Distribution shape — a flat distribution means even spread; a steep drop-off means concentration
- Outliers — unusually tall or short bars may indicate interesting population characteristics
Treemaps
Treemaps display hierarchical data as nested rectangles. Larger rectangles represent more common attributes. They're especially useful for visualizing many categories at once.
What to look for:
- Dominant categories — the largest rectangles are the most common values
- Variety — many small rectangles indicate high diversity in that attribute
- Groupings — related values may cluster together visually
Comparing Populations
To compare two populations, open each in separate browser tabs and look at the same chart type side by side. This is useful for understanding how different target audiences differ in demographics or preferences.
Creating Populations
Populations are typically created during campaign setup or through the Agent Builder. The Populations tab is primarily for viewing and managing existing populations.
Best Practice
Keep populations focused on specific demographics or use cases. Use clear names like "US Millennials - Urban - Tech Enthusiasts" so your team can quickly find the right audience.
Humans
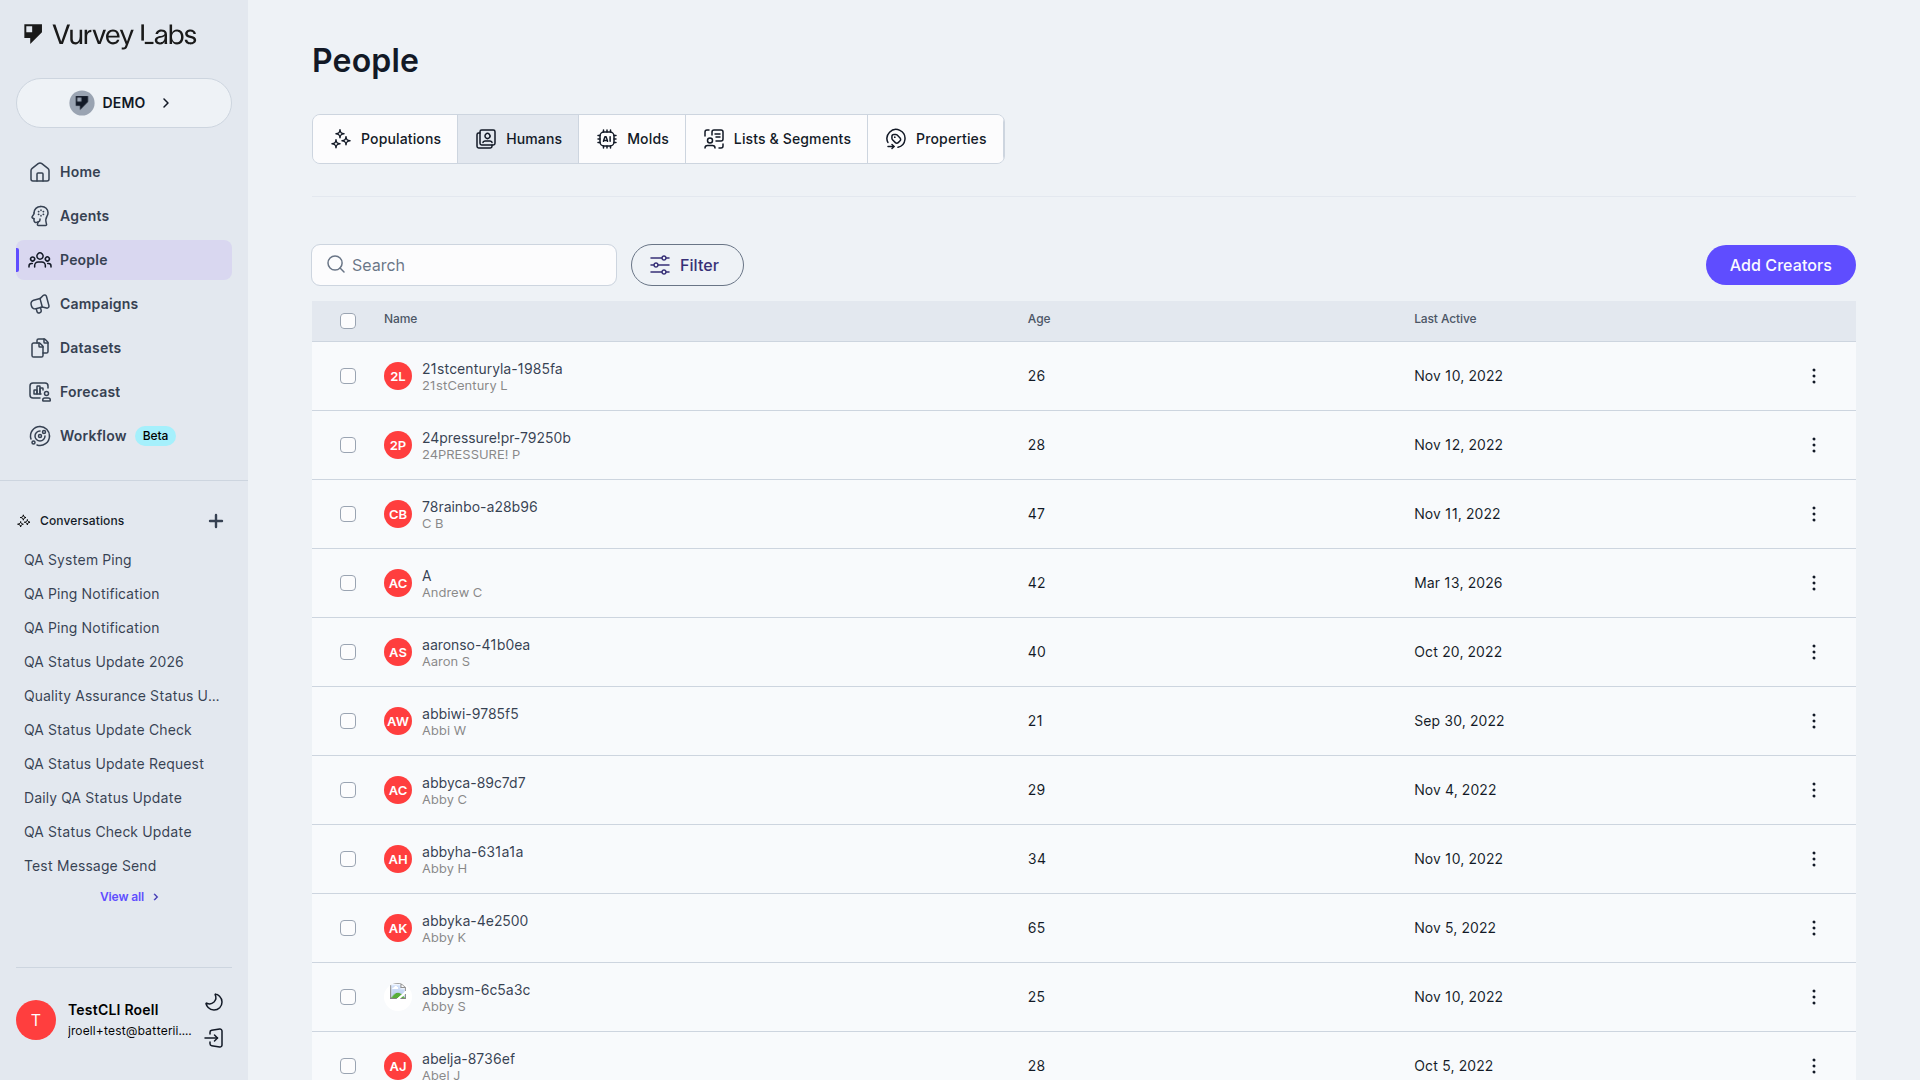
The Humans tab is where you manage your real participants — the people who receive campaign invitations and provide genuine video feedback.
Viewing Your Contacts
Contacts appear in a sortable table with columns for Name, Age, Last Active, and action options. Click any column header to sort.
Use the search bar to find contacts by name. Click the filter button to narrow results by campaign participation or custom property values.
Build Richer Profiles Over Time
Combine multiple filters to uncover insights — for example, find participants who completed your holiday campaign AND have a "Gold" loyalty tier, or locate consumers in a specific region who haven't been surveyed recently.
Adding Contacts
Click + Add to open the current Add Creators modal. You can paste one or more email addresses, then either add them directly or use the modal's Add to list dropdown to place them into an existing list first.
Bulk Actions
Select multiple contacts using the checkboxes, then use the bulk action buttons to:
| Action | What It Does |
|---|---|
| Delete | Permanently remove selected contacts and their response history |
| Add to List | Add contacts to an existing list or create a new one |
| Add Property | Assign a property value to all selected contacts at once |
The Humans table also has a row-level menu on each contact for contextual actions such as Delete/Remove and Add Property. Delete actions use a confirmation step.
The Add Property flow opens a modal where you choose the property, choose the value, and decide whether to Add value or Replace value.
Contact Profiles
Click a contact's name to open their full profile.
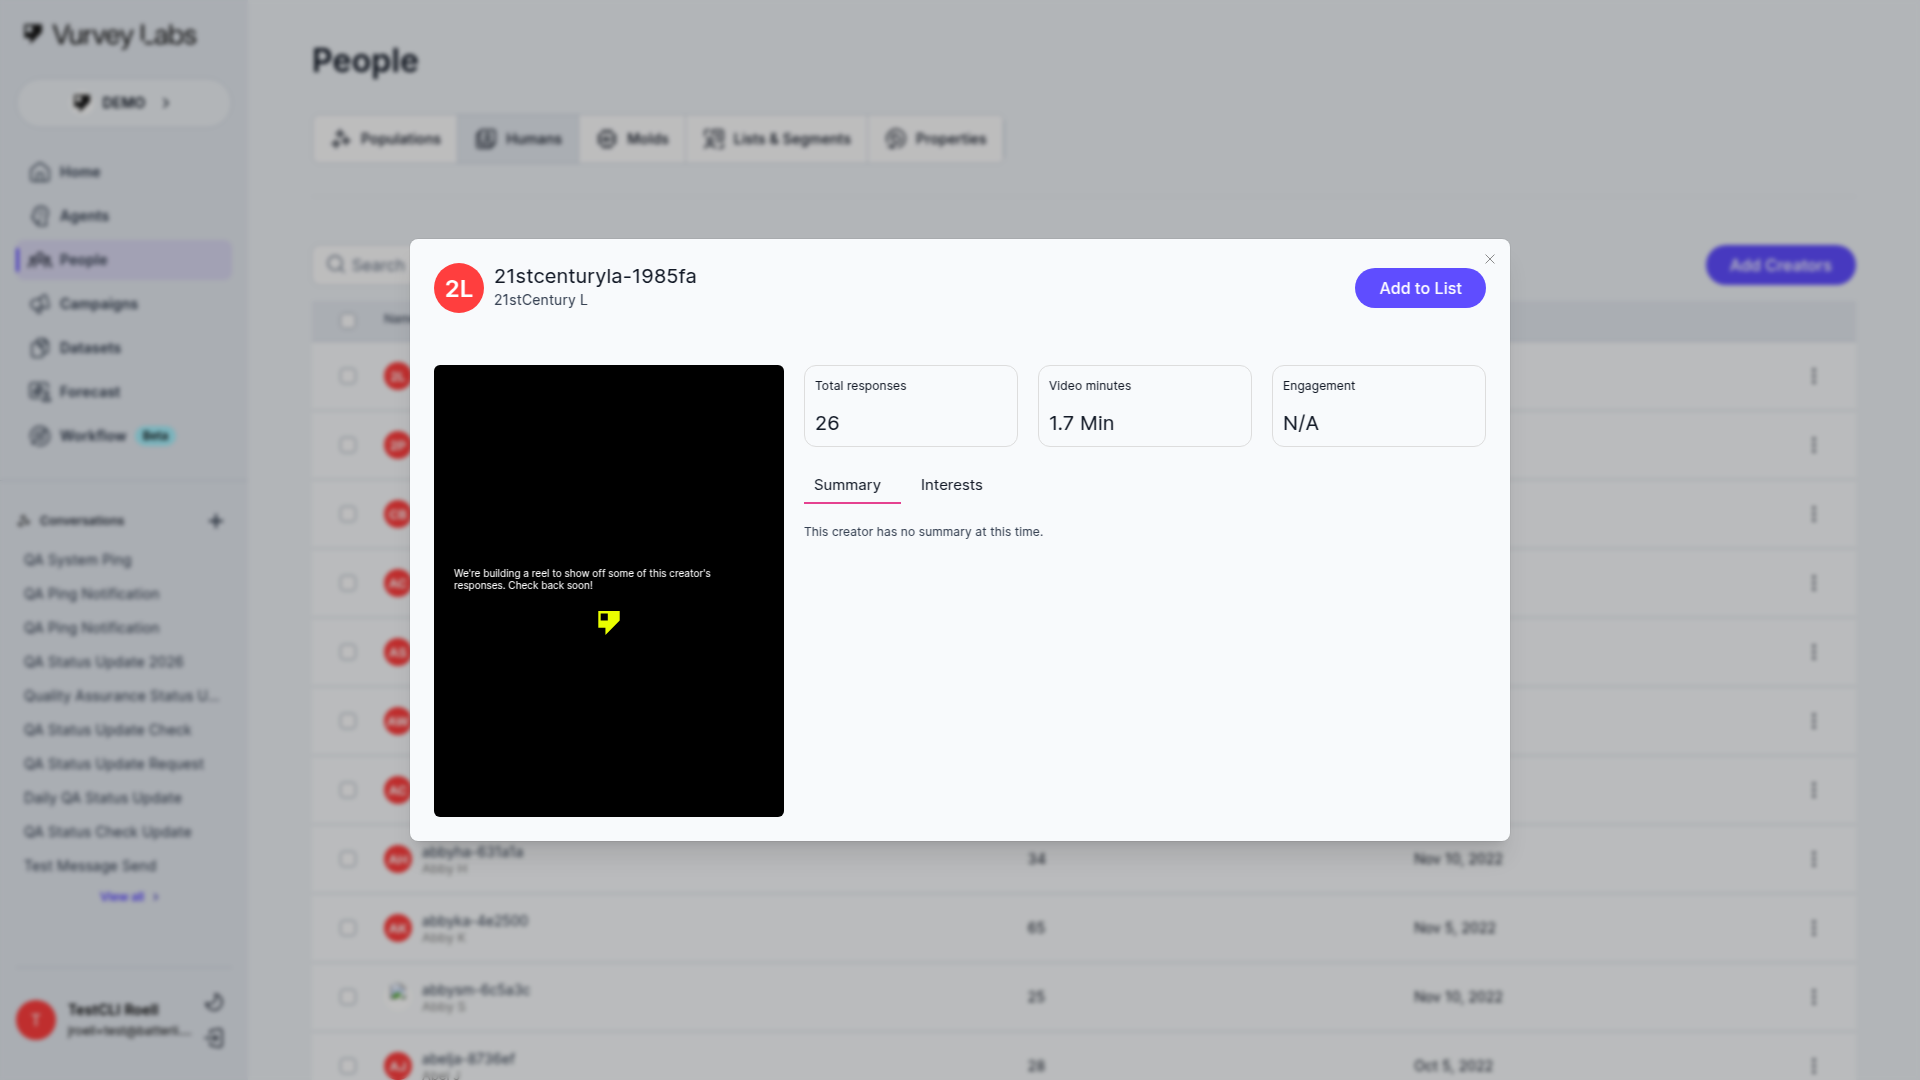
A profile includes:
- Basic Information — Name, email, avatar, age, gender, location
- Stats Cards — Total responses, Video minutes, and Engagement metrics
- Summary tab — Overview of the contact's activity and attributes
- Interests tab — Topics and categories the contact has shown interest in
Contact Profile: Deep Dive
Each contact profile is organized into sections that give you a 360-degree view of the participant.
Basic Information
The header area shows the contact's name, email address, avatar (if available), age, gender, and location. This information may come from their account registration or from properties you've imported.
Editing Contact Information
Click on any editable field to update it directly. Changes are saved immediately. Only users with Edit permission on the People section can modify contact information.
Custom Properties
All custom properties assigned to this contact appear in a organized list. Each property shows its key and current value. You can edit property values directly from the profile page.
Campaign History
A chronological list of every campaign this contact has participated in, showing:
- Campaign name and date
- Completion status (completed, partial, not started)
- Number of questions answered
Click any campaign entry to jump to that contact's specific responses.
Response Data
For each completed campaign, you can view:
- Video responses — watch the recorded video directly in the profile
- Text transcripts — read the AI-generated transcript of video responses
- Written answers — see responses to text-based questions
- Timestamps — when each response was submitted
Segment Memberships
Shows all lists and segments this contact belongs to. This helps you understand how this person fits into your audience organization and which campaigns they might be targeted for next.
How Contacts Join Your Workspace
| Source | How It Works |
|---|---|
| Email Invitation | Direct invite from the Humans tab |
| Campaign Links | Public or shared campaign links |
| CSV Import | Bulk import via Properties upload |
| QR Codes | Scanned from physical materials |
Lists & Segments
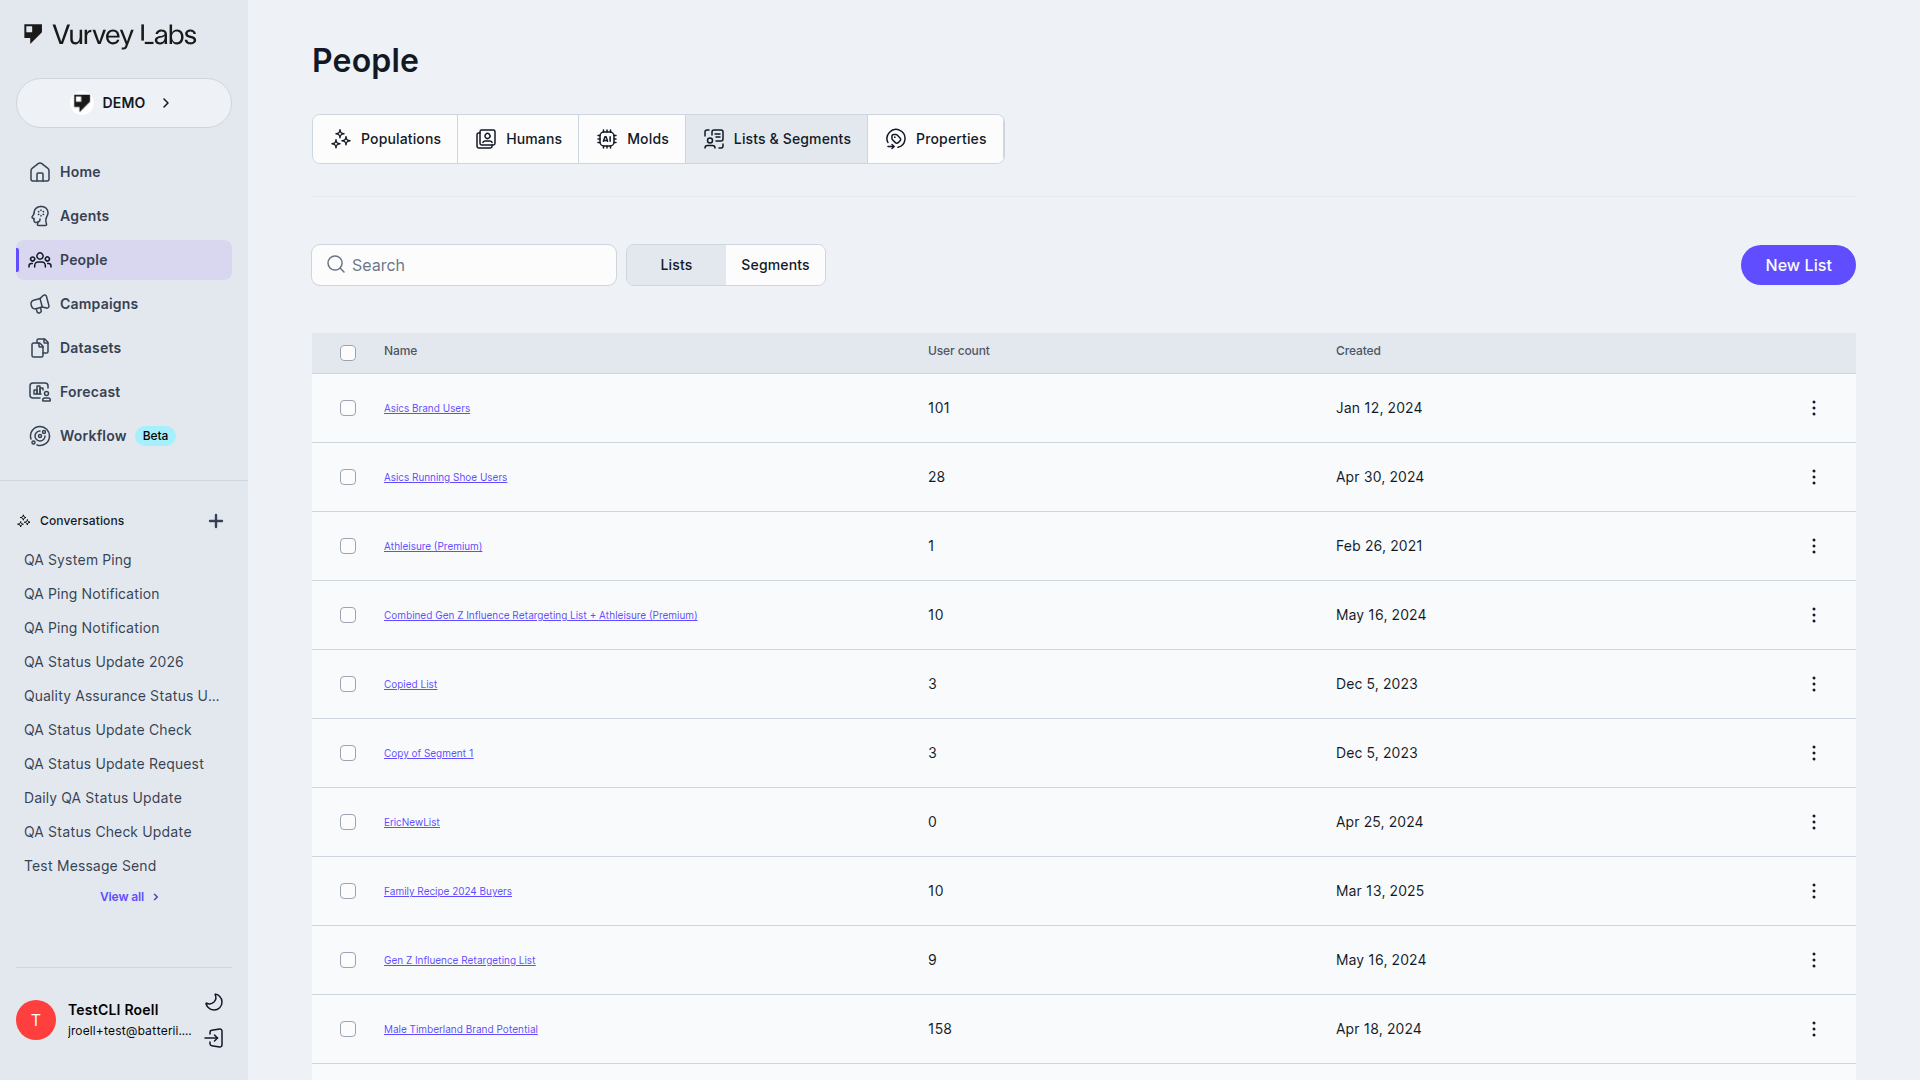
Organize your contacts into reusable groups for campaign targeting, analysis, and ongoing engagement. Use the dropdown at the top to switch between Lists and Segments.
Lists vs. Segments
| Lists | Segments | |
|---|---|---|
| Type | Static | Dynamic |
| How membership works | You manually add and remove contacts | Contacts are automatically included based on rules |
| Updates | Only when you make changes | Automatically as contact data changes |
| Best for | VIP panels, project teams, hand-picked groups | Behavioral targeting, demographic filters |
Working with Lists
Lists are manually managed groups. Click New List to create one, then add contacts from the Humans tab using bulk actions.
The list table shows Name, User count, and Created date. Click any list name to edit it inline. Use the three-dot menu to edit, duplicate, or delete a list.
Bulk actions when multiple lists are selected:
- Delete — Remove all selected lists
- Combine Lists — Merge selected lists into a single new list
Use Case
Create a list called "2026 Holiday Research Panel" for a seasonal campaign, or maintain a "VIP Beauty Enthusiasts" list of your most engaged participants who get early access to new studies.
Working with Segments
Segments are dynamic groups that automatically update as contacts match your rules. Click New Segment to open the segment-builder modal.
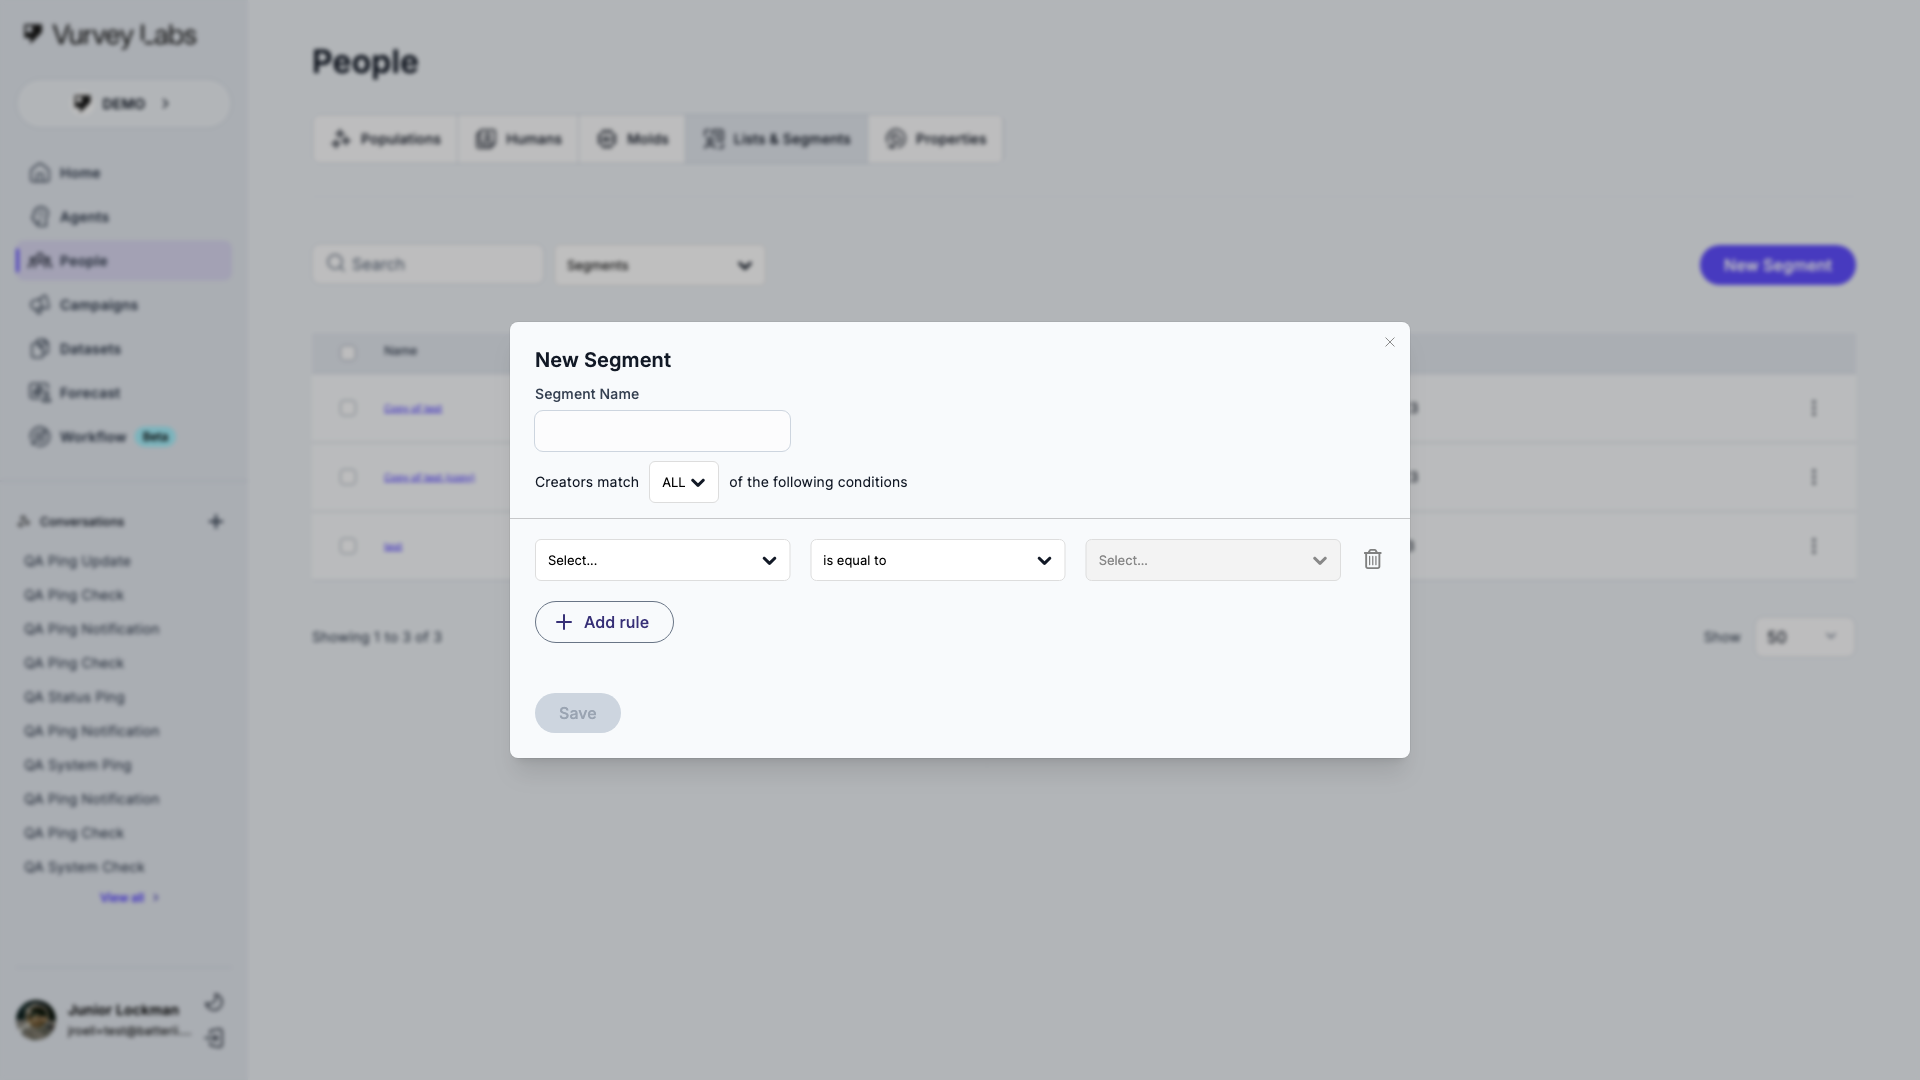
Building a segment:
- Choose a Property to filter on (age, location, custom attributes, etc.)
- Select an Operator — Equals or Not Equals
- Enter the Value to match
- Choose Any (OR logic — match if any rule is true) or All (AND logic — must match every rule)
- Preview matching contacts and save
Example segments for a beauty brand:
| Segment | Rules | Use Case |
|---|---|---|
| Premium Skincare Consumers | purchase_frequency > 4/year, category = "skincare" | High-value product research |
| Gen Z Beauty Enthusiasts | age between 18-27, interest contains "beauty" | Trend research |
| Dormant Participants | last_active > 90 days | Re-engagement campaigns |
| Northeast US Panel | region = "Northeast" | Regional product testing |
Each segment row uses a contextual menu with Edit, Copy, and Delete. Bulk actions across selected segments currently include Delete and Create Combined Segment, and both single-delete and bulk-delete flows use confirmation modals.
Segment Builder: Complete Examples
Here are detailed segment rule configurations for common research scenarios. Use these as templates and adapt the property names to match your workspace.
1. High-Value Beauty Consumers
Goal: Identify your most engaged, high-spending beauty consumers for premium product research.
| Rule | Property | Operator | Value |
|---|---|---|---|
| Rule 1 | purchase_frequency | greater than | 6 |
| Rule 2 | category | contains | skincare |
| Rule 3 | satisfaction_score | greater than or equal to | 4 |
| Logic | All (AND) — contact must match every rule |
Result: Contacts who buy skincare products more than 6 times a year AND report high satisfaction.
2. At-Risk Customers
Goal: Find customers who may be disengaging so you can target them with re-engagement campaigns.
| Rule | Property | Operator | Value |
|---|---|---|---|
| Rule 1 | last_purchase | greater than | 90 days ago |
| Rule 2 | satisfaction_score | less than | 3 |
| Logic | All (AND) |
Result: Contacts who haven't purchased in 90+ days AND have low satisfaction scores. These are prime candidates for win-back research.
3. Gen Z Trendsetters
Goal: Build a panel of young, digitally engaged early adopters for trend and concept testing.
| Rule | Property | Operator | Value |
|---|---|---|---|
| Rule 1 | age | between | 18 and 27 |
| Rule 2 | social_media_engagement | equals | high |
| Rule 3 | early_adopter | equals | true |
| Logic | All (AND) |
Result: Young consumers who are highly active on social media and tend to adopt new products early.
4. Regional Research Panel
Goal: Create a geographic panel for region-specific product testing or ad campaign evaluation.
| Rule | Property | Operator | Value |
|---|---|---|---|
| Rule 1 | region | equals | Northeast |
| Rule 2 | language | equals | English |
| Rule 3 | available_for_research | equals | true |
| Logic | All (AND) |
Result: English-speaking contacts in the Northeast who have opted in for research participation.
5. Lapsed Participants
Goal: Re-engage experienced participants who haven't been surveyed recently.
| Rule | Property | Operator | Value |
|---|---|---|---|
| Rule 1 | last_survey_completed | greater than | 180 days ago |
| Rule 2 | total_surveys | greater than or equal to | 3 |
| Logic | All (AND) |
Result: Contacts who have completed at least 3 surveys historically but haven't participated in 6+ months. These people know the platform and are likely to provide quality responses if re-engaged.
6. Multi-Category Shoppers
Goal: Find consumers who shop across multiple product categories for cross-selling research.
| Rule | Property | Operator | Value |
|---|---|---|---|
| Rule 1 | categories_purchased | contains | skincare |
| Rule 2 | categories_purchased | contains | haircare |
| Rule 3 | categories_purchased | contains | makeup |
| Logic | Any (OR) — match if at least two are true |
Segment Rule Logic
- All (AND): Narrows your audience. Every rule must be true. Use when you need a very specific segment.
- Any (OR): Broadens your audience. At least one rule must be true. Use when you want to cast a wider net.
- Combine both: Start with AND for your core criteria, then create additional segments with OR logic for broader targeting.
Properties
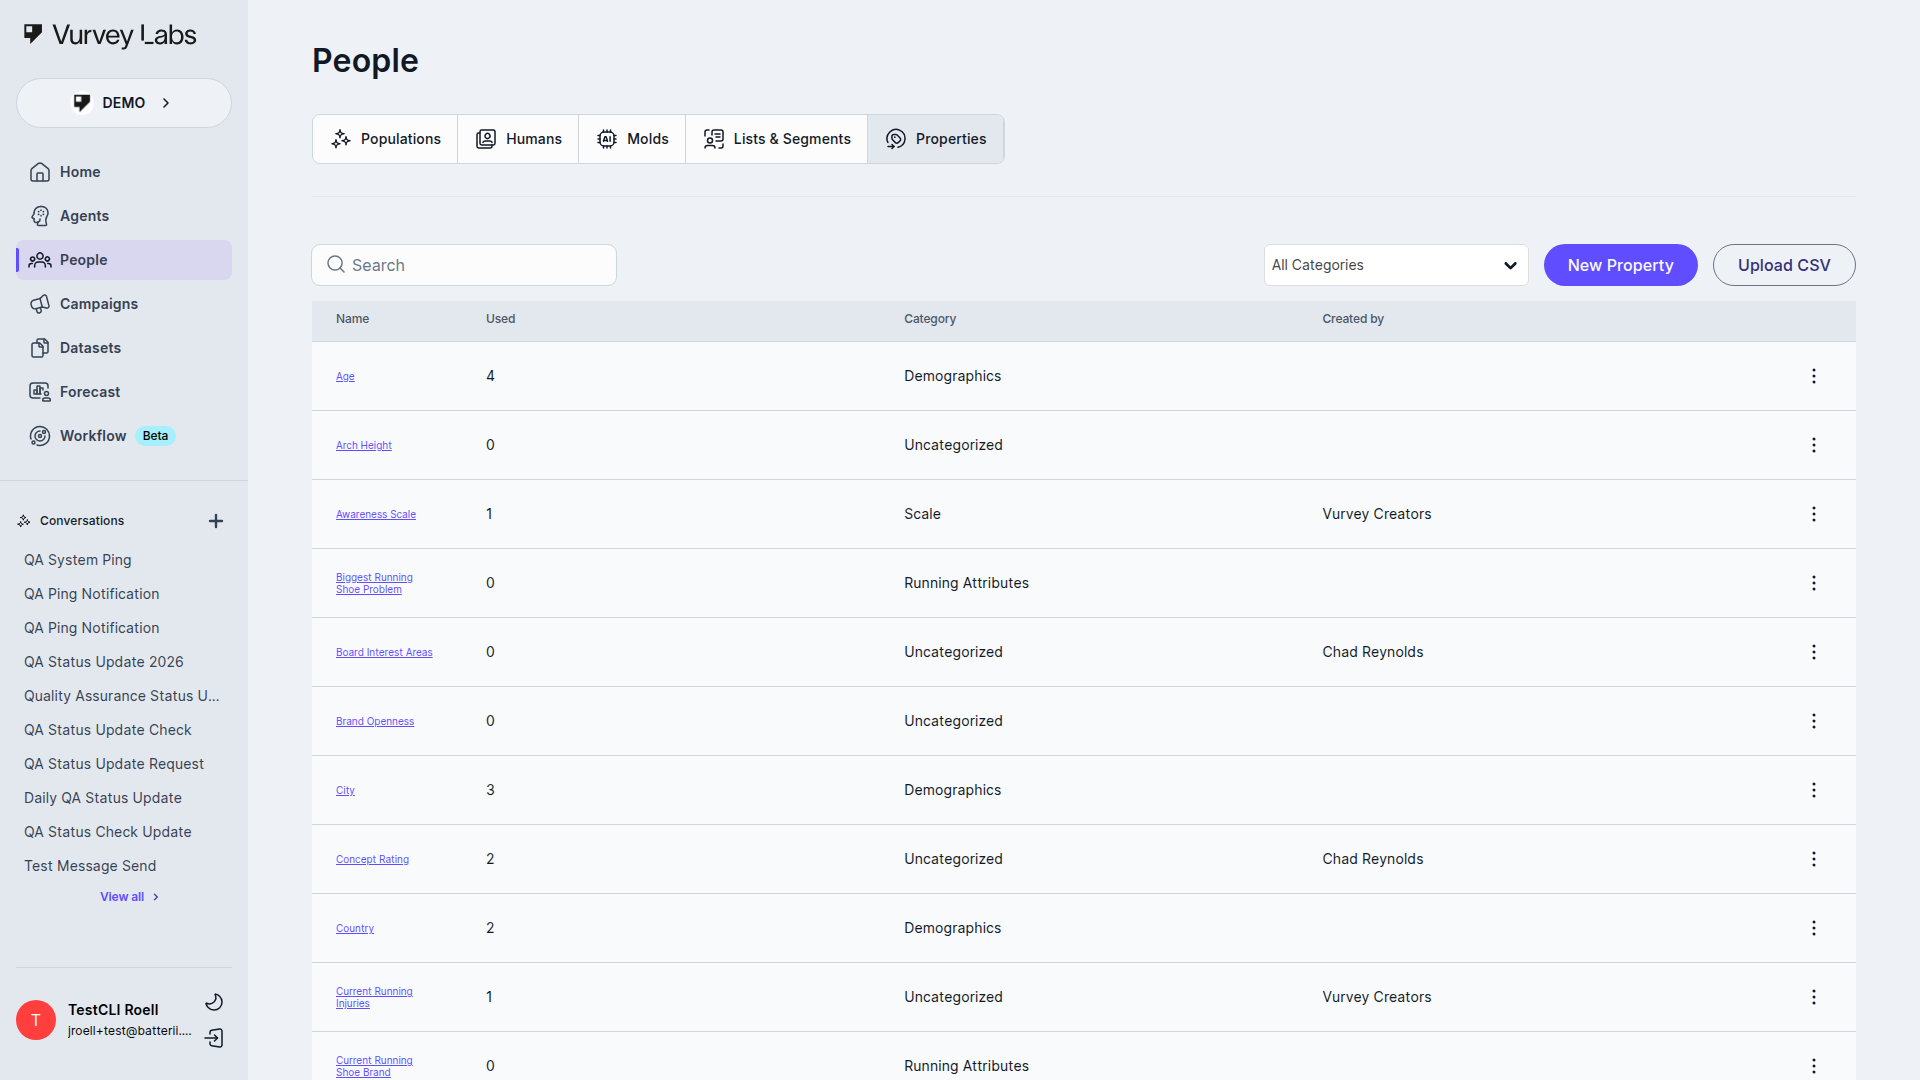
Properties are custom attributes you can track for contacts beyond the built-in fields like name, email, and age. Define any data point relevant to your research — purchase history, loyalty tier, product preferences, or anything else.
Property Types
| Type | Description | Example Use |
|---|---|---|
| Text | Free-form text | Occupation, favorite brand |
| Number | Numeric values | Household income, satisfaction score |
| Date | Calendar date | Last purchase date, signup date |
| Single Select | Choose one option from a list | Membership tier (Gold/Silver/Bronze) |
| Multi-select | Choose multiple options | Product categories of interest |
| Boolean | True/false toggle | Has purchased, opted into marketing |
Creating Properties
Click + New Property to open the property modal, then fill in the name, type, and optionally a category to keep things organized. Property rows also use a three-dot menu for Edit and Delete, and delete actions confirm before they run.
Property Management Best Practices
Standard Properties Every Workspace Should Have
Start with these foundational properties. They support the most common segmentation and targeting use cases:
| Property | Type | Category | Why It Matters |
|---|---|---|---|
| loyalty_tier | Single Select (Gold/Silver/Bronze) | Purchase Behavior | Segment by customer value |
| purchase_frequency | Number | Purchase Behavior | Identify heavy vs. light buyers |
| last_purchase_date | Date | Purchase Behavior | Find lapsed customers |
| preferred_category | Multi-select | Preferences | Target by product interest |
| satisfaction_score | Number (1-5) | Feedback | Track sentiment over time |
| research_opt_in | Boolean | Research | Know who's available for studies |
| source | Single Select | Demographics | Track how contacts joined |
| region | Single Select | Demographics | Geographic targeting |
Naming Conventions
- Use snake_case for property names (e.g.,
purchase_frequency, notPurchase FrequencyorpurchaseFrequency). This keeps things consistent and prevents issues with CSV imports. - Keep names short but descriptive —
loyalty_tieris better thancustomer_loyalty_membership_tier_level. - Use the same property name across all imports. If one CSV uses "region" and another uses "location," you'll end up with two separate properties.
Category Organization
Group your properties into logical categories to keep the Properties page manageable:
| Category | What Goes Here |
|---|---|
| Demographics | Age, gender, region, language, income |
| Purchase Behavior | Frequency, recency, spend level, loyalty tier |
| Preferences | Product interests, brand preferences, communication preferences |
| Research | Opt-in status, last surveyed date, total surveys completed |
| Feedback | Satisfaction scores, NPS, complaint history |
| Campaign | Source, acquisition date, campaign participation |
When to Use Each Property Type
| If you need to... | Use this type |
|---|---|
| Store a category with one answer (e.g., "Gold" or "Silver") | Single Select |
| Allow multiple answers (e.g., interested in skincare AND haircare) | Multi-select |
| Track a number for calculations or comparisons | Number |
| Record a date for time-based segments | Date |
| Store open-ended info like notes or occupation | Text |
| Track a simple yes/no (e.g., opted into marketing) | Boolean |
Managing Categories
Organize properties into categories like "Demographics", "Purchase Behavior", or "Research Preferences" using the category dropdown. Click + Create new category or Edit Categories to open the category-management modals.
Inside an individual property-value table, the current UI also exposes row-level Delete actions and a bulk Add to list flow.
Importing Data with CSV
Upload properties and values in bulk:
- Click the upload button
- Select your CSV file
- In the CSV Upload modal, choose Add values or Replace values
- Upload the file
The modal also includes a Download example CSV file shortcut.
CSV Import: Format Specification
The current Properties CSV upload expects a narrow three-column file, not a wide spreadsheet with one property per column.
Required Columns
| Column | Required? | Description |
|---|---|---|
| EMAIL_OR_CREATOR_TAG | Yes | The contact identifier used to match the person |
| ATTR_NAME | Yes | The property name that already exists in Vurvey |
| ATTR_VALUE | Yes | The value to add or replace for that property |
Format Rules
| Rule | Details |
|---|---|
| Encoding | UTF-8 (most spreadsheet apps export this by default) |
| Header row | First row must contain column headers |
| One property per row | Each row maps one contact to one property/value pair |
| Existing property names | ATTR_NAME should match a property that already exists in your workspace |
| Single file | The upload modal accepts one CSV at a time |
Sample CSV
EMAIL_OR_CREATOR_TAG,ATTR_NAME,ATTR_VALUE
jane@example.com,loyalty_tier,Gold
jane@example.com,preferred_category,skincare
john@example.com,loyalty_tier,Silver
john@example.com,research_opt_in,true
Common CSV Errors and Fixes
| Error | Cause | Fix |
|---|---|---|
| "No matching contacts found" | Email addresses don't match existing contacts | Check for typos, extra spaces, or different email domains |
| "Unknown property" | ATTR_NAME does not match an existing property | Create the property first, or fix the property name spelling |
| Garbled characters (?, ÃÂ) | Wrong file encoding | Re-save as UTF-8 in your spreadsheet app |
| Extra rows imported | Hidden rows or trailing blank rows | Delete empty rows at the bottom of your spreadsheet |
CSV Import Best Practices
- Test with a small file first — try 5–10 rows before importing hundreds.
- Use "Add values" first if you're appending data to existing contacts.
- Use "Replace values" carefully because it overwrites the targeted values.
- Open in a text editor to verify formatting if your spreadsheet app adds unexpected characters.
Deleting Properties
When you delete a property, all values assigned to contacts are also removed. Any segments using that property will need to be updated. Check the "Used" count before deleting.
Molds (Enterprise)
Access-Controlled Feature
Molds are not available in every workspace. In current master, access depends on the mold-related access path and feature configuration for your workspace.

Molds are reusable persona templates for consistent AI population generation. Design a mold once — defining demographic parameters, behavioral characteristics, and generation rules — then use it to create unlimited AI personas with consistent attributes.
Mold Lifecycle
| Status | Description |
|---|---|
| Draft | Work in progress, preview only |
| Live | Published and ready for population generation |
| Archived | Deprecated but retained for reference |
Mold Details
Click any mold to open its configuration page.
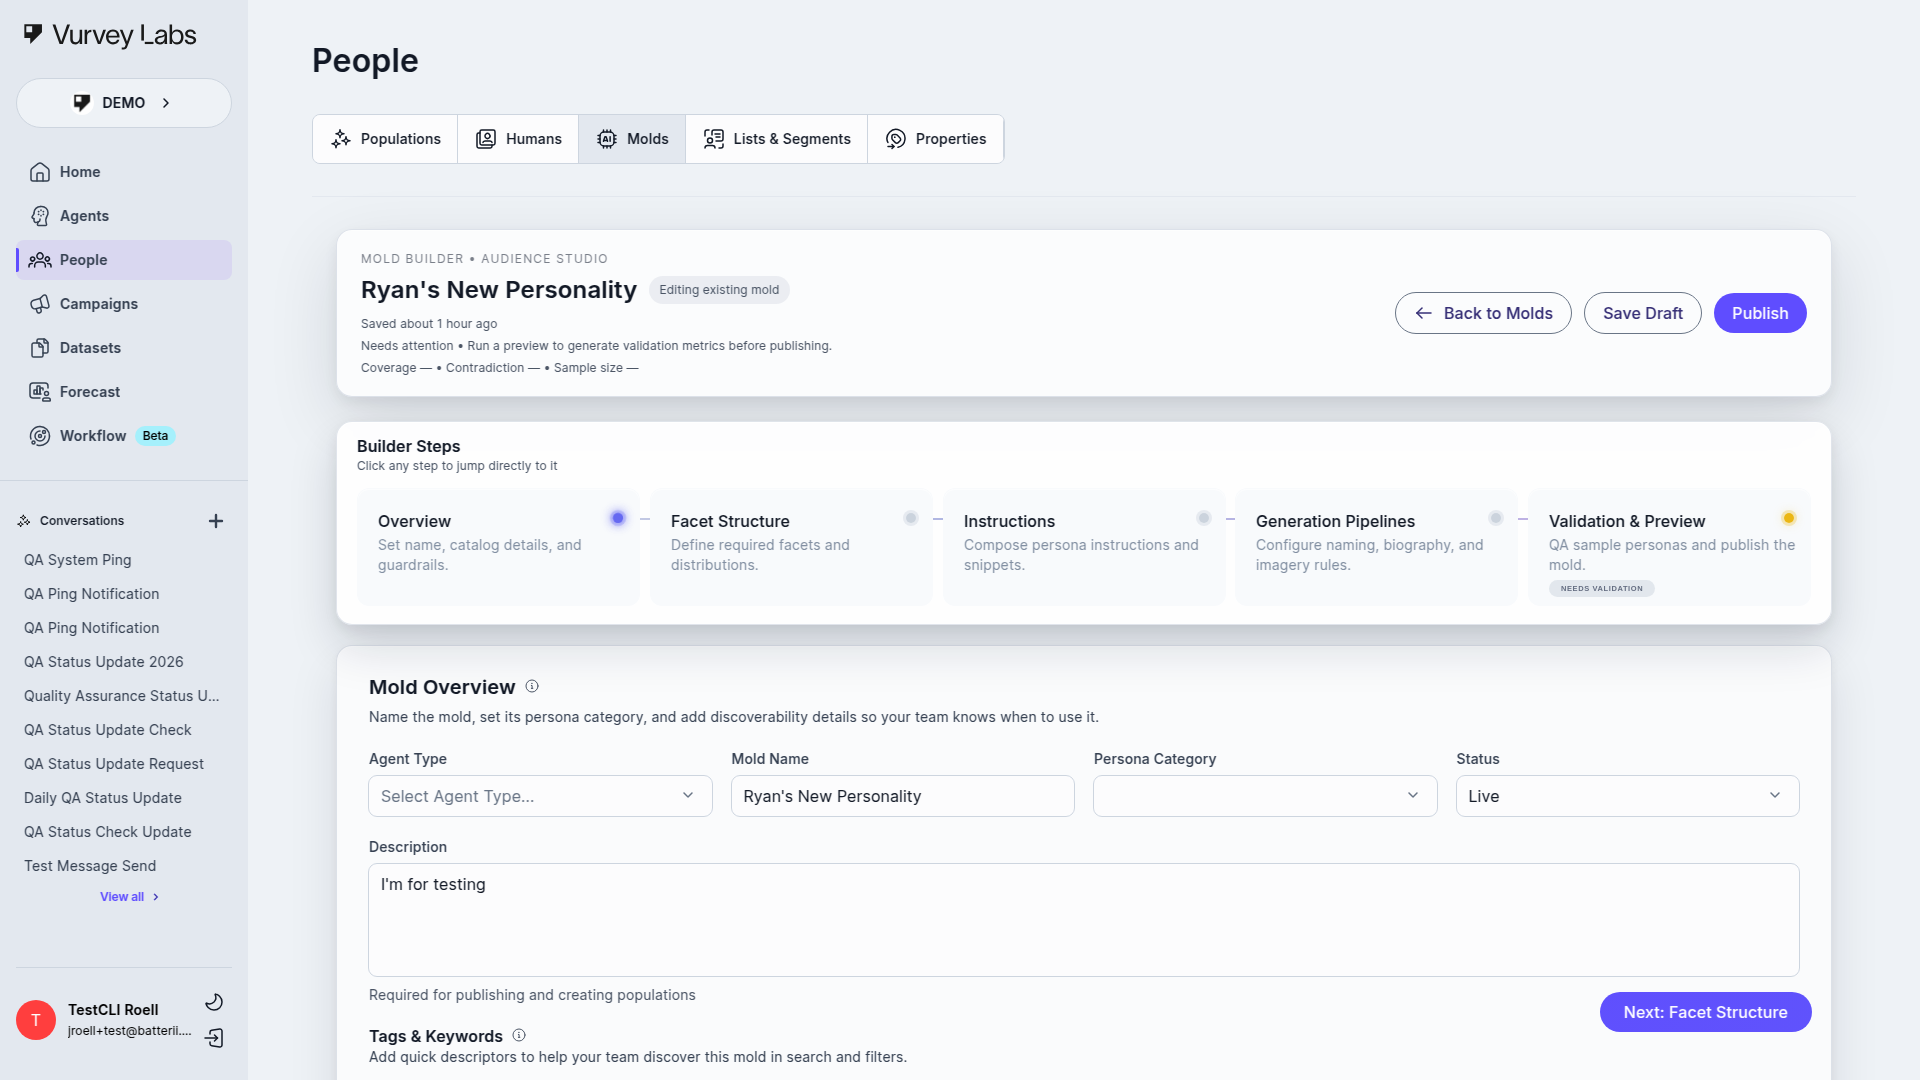
From here you can edit the mold's name, description, category, status, and configuration. The system validates readiness before publishing — checking required fields, valid configuration, and demographic coverage thresholds.
Integration with Campaigns
Your People data connects directly to campaigns, creating a powerful targeting and analysis loop.
Targeting Segments When Launching Campaigns
When you create or launch a campaign, you can select specific lists or segments as your target audience:
- Create your campaign in the Campaigns section.
- During setup, choose your target audience — select from your existing lists or segments.
- Only contacts in the selected group receive the campaign invitation.
- As the campaign runs, new contacts who join the segment (in dynamic segments) may also be included.
Targeting Strategy
- Use segments for ongoing campaigns — dynamic membership means new qualifying contacts are automatically included.
- Use lists for one-time studies — static membership ensures a fixed group receives the invitation.
- Combine both — target a segment for broad reach, then create a list of the most engaged respondents for follow-up studies.
Using Populations for AI Testing
Before launching a campaign to real participants, test it with AI populations:
- Create an AI population that matches your target demographic.
- Run your campaign against the population to collect simulated responses.
- Review the simulated results — Are the questions clear? Are responses diverse? Do you see the insights you expected?
- Refine your campaign based on what you learn, then launch to real contacts.
Tracking Participation Across Campaigns
Use the Humans tab and contact profiles to track how individual contacts participate over time:
- Filter by campaign to see who participated in a specific study.
- Check individual profiles to see a contact's full campaign history.
- Create segments based on participation patterns (e.g., "completed 3+ campaigns" or "last surveyed more than 90 days ago").
- Avoid survey fatigue by checking how recently contacts were last surveyed before targeting them again.
Common Workflows
Build a Research Panel for a New Product Launch
- Import contacts — Upload a CSV with demographic data via Properties
- Add custom properties — Create attributes like "product_interest", "purchase_frequency", and "loyalty_tier"
- Create segments — Build dynamic groups like "Premium Skincare Buyers" or "Available for Research" (last surveyed > 30 days ago)
- Launch campaigns — Target your segments when you're ready to collect feedback
Test Campaign Questions with AI Before Going Live
- Create an AI population during campaign setup that matches your target audience demographics
- Run the campaign against the AI population to collect simulated responses
- Review the results — Are the questions clear? Are you getting diverse perspectives?
- Refine and relaunch to real participants with confidence
Segment Your Beauty Enthusiasts by Purchase Frequency
- Create properties for "purchase_frequency" (Number) and "product_category" (Multi-select)
- Import data via CSV from your CRM
- Build segments like "Heavy Buyers" (purchase_frequency > 8/year) and "Occasional Shoppers" (purchase_frequency 1-3/year)
- Compare insights — Run the same campaign to both segments and see how responses differ
Troubleshooting
Contacts Not Appearing
- Verify the invitation was sent and the email address is correct
- Ask the contact to check their spam folder
- Make sure you're viewing the correct workspace
- Try refreshing the page
Segment Returns Unexpected Results
- Review each rule carefully — check that Any vs. All logic is correct
- Verify that contacts have the expected property values set
- Test with a known contact to confirm matching behavior
CSV Import Fails
- Save as UTF-8 encoding
- Match column headers exactly to property names
- Use YYYY-MM-DD format for dates
- Try a small test file first (5-10 rows)
Duplicate Contacts
- Search for the contact by email to confirm the duplicate exists.
- Duplicates usually happen when the same person is invited via different methods (email invite + campaign link) or when email addresses have slight variations (e.g.,
jane@company.comvs.jane+research@company.com). - To resolve, decide which profile has better data, then manually add any missing properties from the duplicate to the primary profile.
- Delete the duplicate contact.
- To prevent future duplicates, standardize on one email address per contact and use CSV imports with the email column to match existing records.
Property Values Not Showing Correctly
- Check that the property type matches the data. For example, if you created a "Number" property but imported text values, the data may not display correctly.
- For Single Select properties, verify that the imported value exactly matches one of the defined choices (including capitalization).
- For Date properties, confirm the format is YYYY-MM-DD.
- If values appear garbled, the CSV file may not be UTF-8 encoded. Re-export from your spreadsheet with UTF-8 encoding.
- Try editing the value directly on a contact profile to see if it saves correctly — this can help isolate whether the issue is with the import or the property definition.
Segment Not Updating Dynamically
- Confirm the segment uses dynamic rules (segments, not lists). Lists are static and only update when you manually change them.
- Check that the property values for your contacts have actually changed. The segment only updates when the underlying data changes.
- Verify the rules still make sense — if you changed a property from Text to Number type, existing rules may not match anymore.
- Try editing the segment, making no changes, and saving again. This can trigger a refresh.
- If a segment shows 0 contacts when you expect more, review each rule individually to find the one that's too restrictive.
CSV Import Column Mapping Issues
- Column headers must match property names exactly — including capitalization, spaces, and special characters.
- Remove any extra spaces before or after header names (common in Excel exports).
- If you have columns in your CSV that don't match any property, they'll be ignored silently. Check the import summary to see which columns were mapped.
- For multi-select properties, use semicolons to separate values (e.g.,
skincare;haircare), not commas (which would be interpreted as a CSV delimiter). - If column mapping seems random, open your CSV in a text editor to check that it's actually comma-delimited and not tab-delimited or semicolon-delimited.
Population Charts Showing Unexpected Distributions
- Check the population size — very small populations (under 20 personas) may not show representative distributions.
- Verify the population was generated with the correct demographic parameters. If the source data was skewed, the population will reflect that skew.
- Use the category pills to filter which attributes are displayed — sometimes an unexpected distribution in one chart makes sense when viewed alongside other attributes.
- If the population doesn't match your target demographic, consider regenerating it with more specific parameters.
Frequently Asked Questions
Click to expand
Q: How many contacts can my workspace hold? There's no hard limit on the number of contacts. Workspaces with thousands of contacts work well. If you have very large lists (10,000+), filtering and search become especially important for finding the right people.
Q: Can I export my contact list? Currently, contact export is handled through your workspace settings or by contacting support. Individual contact data can be viewed in profile pages.
Q: What's the difference between a population and a list? A population is a group of AI-generated personas — they don't represent real people. A list is a manually curated group of real human contacts. Use populations for quick AI testing; use lists for targeting real participants.
Q: Can I use the same contact in multiple campaigns? Yes. A contact can participate in as many campaigns as they're invited to. Use the "last surveyed" property and segments to avoid over-surveying.
Q: How do I prevent survey fatigue? Track the last_survey_completed date as a property. Create a segment rule like "last_survey_completed > 14 days ago" to exclude recently surveyed contacts from new campaigns.
Q: Can I merge two lists? Yes. Select multiple lists, then use the Combine Lists bulk action to merge them into a single new list.
Q: Do segments update in real time? Segments update as contact data changes. When you update a property value (manually or via import), any segments using that property will reflect the change.
Q: What happens when I delete a contact? The contact and all their response data are permanently removed. They'll also be removed from all lists and segments. This action cannot be undone.
Q: Can I re-invite a deleted contact? Yes, but they'll start fresh as a new contact. Their previous response history will not be recovered.
Q: How do populations work with campaigns? During campaign setup, you can select an AI population as your target audience. The population's AI personas will "respond" to your campaign questions, giving you simulated data that you can analyze before launching to real participants.